Wastewater Reliability: From Recurring Failures to Retrofit.
A sewage pump handling fibrous wastewater experienced recurring clogging and seal failures.
Atlas Electricals · Design experience · By Arpit Bhatt
Begin with the failure mechanism
Repeated blockage and seal failure can tempt a team to replace the seal again. The better starting point is the sequence of events: what entered the pump, where it accumulated, what changed in current or flow, and when leakage began. Fibres can wrap and bridge; an opening large enough for a rigid particle may still collect flexible material.
The project reviewed service history, failed parts and the required duty before developing a wider-passage impeller and a revised casing inlet. The existing motor and installation footprint were retained.
| Basis | Value / decision |
|---|---|
| Reported constraints | Existing motor, piping interfaces and installation envelope. |
| Reported design change | Wider-passage impeller and revised casing inlet. |
| Worked-example inputs | Q = 60 m³/h, H = 20 m, density = 1,000 kg/m³, pump efficiency = 65%. |
| Passage comparison | Equivalent rectangular areas of 70 × 35 and 70 × 50 mm, used only to explain continuity. |
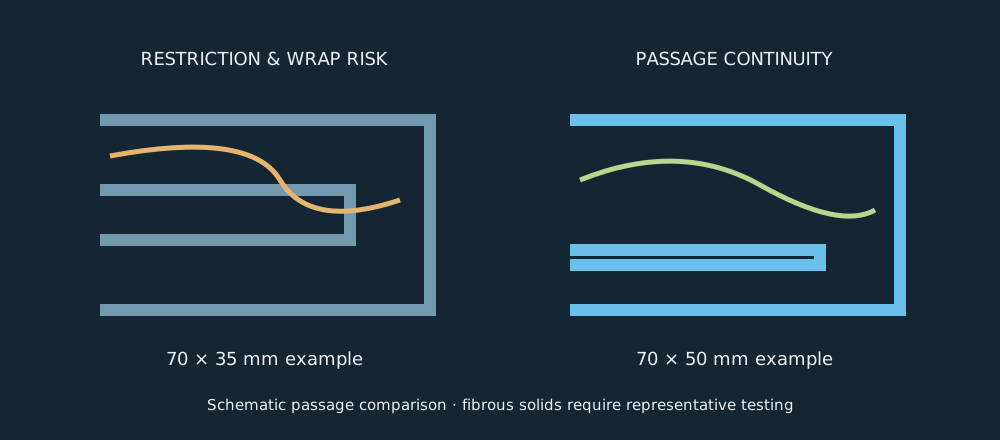
What a wider passage changes—and what it cannot promise
Conservation of mass gives ρQ = ρAv for steady incompressible flow, so v = Q/A. Assume the entire example flow passes through one equivalent section.
A₁ = 0.070 × 0.035 = 0.00245 m² → v₁ = 6.80 m/s
A₂ = 0.070 × 0.050 = 0.00350 m² → v₂ = 4.76 m/s
The area rises by 42.9%; average velocity falls by 30%. For a hypothetical local feature with an unchanged loss coefficient K, the loss h = Kv²/(2g) would fall to (4.76/6.80)² = 49% of its former value. This is a sensitivity comparison. Changing an impeller changes flow direction, slip, recirculation and K; this simple ratio cannot predict the new pump curve.
Lower velocity alone does not guarantee reliability either: reduced transport velocity can encourage settling. The useful question is whether the complete geometry passes the actual solids without compromising head, efficiency, suction behaviour or clearances.
Check the retained motor from energy balance
Head is mechanical energy per unit weight. Multiplying the mass flow ρQ by gH produces hydraulic power. Shaft power is higher because the pump has losses.
Pshaft = ρgQH/η = 3.27/0.65 = 5.03 kW
At η = 0.55, Pshaft = 5.95 kW
A ten-percentage-point efficiency loss increases example shaft demand by roughly 18%. This is why retaining the motor requires a power check across the operating range, not just at the nominal point. Actual motor rating, service conditions, starting behaviour and measured power govern acceptance.
Material selection also follows the fluid: abrasion, corrosion, temperature and solids chemistry influence casing and impeller choices. Seal-face pairing, elastomers and the seal environment must be reviewed with supplier data. Choosing a harder material without checking corrosion or brittle-damage risk is not a complete selection.
Take the retrofit through the full lifecycle
The retrofit was compared with full replacement on casting changes, machining, cost, lead time and disruption. That comparison belongs beside the hydraulic calculation: an elegant component is of limited value if it cannot be manufactured or installed economically.
- Design: preserve interfaces, review passage continuity and document clearances.
- First build: inspect cast and machined dimensions, free rotation and assembly access.
- Test: check flow, head, power, vibration and leakage against agreed acceptance criteria.
- Field review: track service hours, blockage events and seal condition under comparable wastewater conditions.
The reported retrofit met duty, retained the motor and piping interfaces and reduced reported clogging. No numerical before-and-after failure rate is available here. The model, drawings, BOM, specification and field lessons formed the production handover.
Core lesson: reliability emerges from matching the hydraulic geometry, materials, operating environment and maintenance practice to the failure mechanism.
Follow the power into the shaft and key
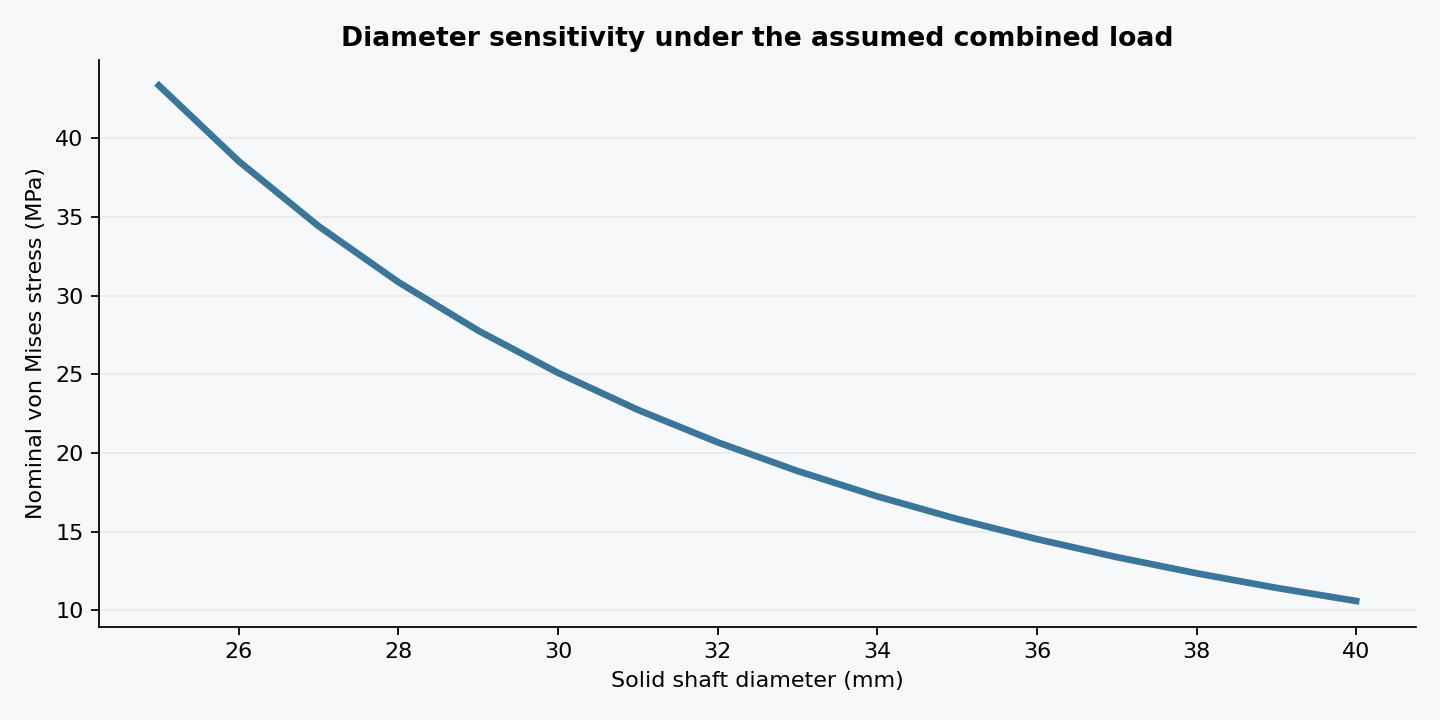
Using the earlier 5.03 kW shaft-input example, assume 1,450 rpm, a 30 mm solid shaft and a 60 N·m bending moment at the critical section. These are educational inputs. Power is torque times angular speed, P = Tω, because each revolution does work T × 2π.
σb = 32M/(πd³) = 22.64 MPa
τ = 16T/(πd³) = 6.25 MPa
σVM = √(σb² + 3τ²) = 25.09 MPa
Bending stress comes from My/I for a circular section, while torsional shear comes from Tr/J. The von Mises combination compares distortion energy with uniaxial yielding. At an assumed yield strength of 350 MPa, the nominal static factor is about 13.9. That is not a complete shaft assessment: the keyway, shoulder radius, corrosion, fatigue and seal deflection can govern.
For an assumed rectangular key 8 mm wide, 7 mm high and 30 mm effective length, the tangential force is 2T/d = 2209 N. Average key shear is 2T/(dbL) = 9.20 MPa; simplified bearing stress over half the key height is 4T/(dhL) = 21.04 MPa. Check the weaker contacting material and effective engagement; this model neglects end concentration and imperfect load sharing.
Why a static pass can still become a fatigue failure
A stationary radial load produces alternating bending stress in a rotating shaft: a material point moves from tension to compression every revolution. Steady torque contributes a mean shear stress. Assume a fatigue stress concentration Kf = 1.6 in bending, Kfs = 1.3 in torsion, corrected endurance strength Se = 160 MPa and ultimate strength Sut = 550 MPa.
σ′m = √3 Kfs τ = 14.07 MPa
1/n = σ′a/Se + σ′m/Sut
n = 3.97 (modified Goodman screening example)
This linear relation connects alternating stress at zero mean stress to ultimate strength at zero alternating stress. It is an approximate fatigue design model, not a predicted service life. The corrected endurance strength must account for actual material, surface finish, size, reliability and environment. Kf depends on geometry and notch sensitivity; it is not interchangeable with every elastic stress-concentration factor.
A clogged impeller may add fluctuating torque and hydraulic force. That changes the load spectrum, so the assumed steady-torque model may no longer apply. Evaluate start-up, stalls and overload protection separately. The design lesson is to connect the failure history to the loading model before choosing a larger shaft or stronger alloy.
Materials and reliability: specify the mechanism you are controlling
For abrasive service, compare wear resistance with casting quality, toughness, machinability and repair practicality. For chemically aggressive wastewater, establish fluid composition and temperature before selecting corrosion-resistant materials. For the seal, examine dry running, solids at the faces, shaft movement and elastomer compatibility. A material substitution cannot compensate for a poor seal environment.
Use a simple verification matrix: passage change → representative solids test; retained motor → absorbed-power curve; revised impeller → balance and vibration check; shaft and seal interfaces → runout and leakage inspection. Record comparable exposure when reporting reliability. For example, three stoppages in 600 operating hours is 5 per 1,000 hours; one in 800 hours is 1.25 per 1,000 hours. This hypothetical 75% rate reduction illustrates the reporting method, not this project’s measured improvement. Small counts and changing wastewater conditions limit the conclusion.
Download the worked-example calculation results (CSV) ↗
Continue exploring
3D model • Component drawings • BOM • Technical specification • Field review