Scope of this study
Reported project: a duplex booster at 20 m³/h and 40 m head experienced frequent starts, surges and repeated seal failures. The tank increased from 80 to 200 L; pre-charge and the control band were reviewed. Shop checks reported steadier pressure and less cycling.
Worked example: pressures, lead-pump flow and cycle counts below are teaching assumptions. CAD shows arrangement envelopes, not a pressure-vessel design. No measured start-frequency reduction or claim that tank size alone resolved every seal failure is made.
1. Think of the tank as a buffer between two different flow rates.
A pump may deliver far more water than a building needs at low demand. Without useful storage, pressure rises quickly, the pump stops, a small withdrawal drops pressure, and the pump starts again. The problem is not simply “too little pump capacity.” It is a mismatch between instantaneous supply, demand and control logic.
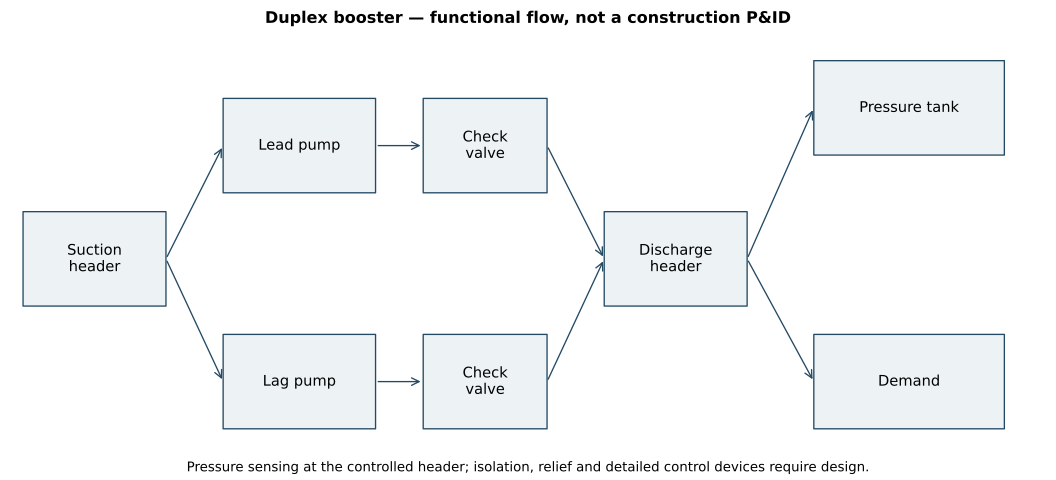
In this project I mapped the pumps, headers, check valves, tank, pressure switch and isolation valves as one system. The duty range was checked first. Drawdown calculations then supported a larger tank and a wider pressure-switch band within the system limits, with pre-charge matched to the revised cut-in arrangement.
A useful everyday example: imagine a tap supplying 100 L/min into a bucket while another outlet removes 25 L/min. When the supply runs, the bucket gains 75 L/min. When it stops, the bucket loses 25 L/min. The usable space between the high and low levels controls the time between starts. A pressure tank does the same job, using compressed gas instead of an open water level.
2. Known values and calculation assumptions.
| Quantity | Value | Basis |
|---|---|---|
| Package duty | 20 m³/h at 40 m | Reported project |
| Tank change | 80 → 200 L | Reported project |
| Cut-in / cut-out | 3.0 / 4.0 bar gauge | Worked-example assumptions |
| Pre-charge | 2.8 bar gauge | Worked-example assumption; follow the selected manufacturer |
| Atmosphere | 1.01325 bar absolute | Reference assumption |
| Lead pump delivery | 100 L/min | Constant-flow approximation over this pressure band |
| Demand | 25 L/min | Constant example demand |
The assumed lead-pump flow is not the package duty converted to L/min. The package duty is 333.3 L/min; a real analysis needs individual pump curves and staging logic. A pump’s 40 m differential head also does not uniquely set the discharge gauge pressure: suction pressure, elevation and losses matter.
3. Derive drawdown from the ideal-gas relationship.
Start with pV = mRT. For a fixed mass of gas at constant temperature, mRT is constant, giving Boyle’s law: pV = constant. Assume the gas initially occupies nominal tank volume Vₜ at pre-charge p₀, with the water side empty.
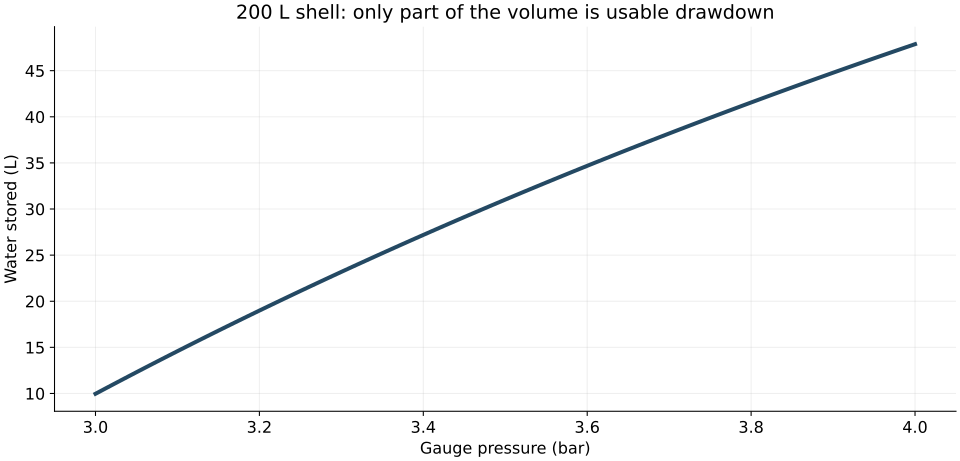
Vgas(p) = p₀Vₜ/p
Vwater(p) = Vₜ − Vgas = Vₜ(1 − p₀/p)
Drawdown is water released while pressure falls from cut-out to cut-in. Subtract the two stored-water volumes:
ΔV = Vₜp₀(1/pin − 1/pout)
All pressures in this equation must be absolute. Gauge pressure is measured relative to local atmosphere; gas compression depends on the pressure relative to vacuum. Here p₀ = 3.81325 bar absolute, pᵢₙ = 4.01325 and pₒᵤₜ = 5.01325.
= 0.189531
80 L tank → 15.16 L usable drawdown
200 L tank → 37.91 L usable drawdown
A 200 L tank does not deliver 200 L between starts. At the same pressure settings it provides 2.5 times the drawdown of an 80 L tank. Actual bladder geometry, gas temperature and manufacturer acceptance-volume data can change usable storage.
4. Independently reconstruct the volume balance.
For the 200 L tank, calculate gas volume separately at both switch points using Vgas = p₀Vₜ/p. Subtract each from 200 L to obtain stored water, then subtract the two water volumes. This returns the same 37.91 L drawdown without using the compact drawdown formula.
Check the physical limits too: when cut-out approaches cut-in, drawdown approaches zero; doubling tank volume doubles drawdown; and pre-charge must remain consistent with the intended bladder operating range. Agreement checks the algebra, not the real tank’s acceptance volume.
If compression is too fast for the isothermal assumption, use pVⁿ = constant as a sensitivity model. Then Vgas = Vₜ(p₀/p)1/n. The exponent depends on heat transfer; do not assign an adiabatic exponent and call it a measured condition.
5. Turn storage into run time and start frequency.
Let Qp be pump delivery and Qd be demand, in L/min. With the pump off, the tank empties at Qd. With one pump on, it fills at the net rate Qp − Qd. Conservation of water gives:
ton = ΔV/(Qp − Qd)
N = 60/(toff + ton) starts/hour
At Qp = 100 L/min and Qd = 25 L/min:
→ 74.20 starts/hour
200 L tank: off = 1.5162 min; on = 0.5054 min
→ 29.68 starts/hour
The ideal model predicts a 60% reduction at unchanged pressures and flows. These are calculated examples, not shop-test start counts. The 200 L result still requires comparison with the actual motor’s permitted starts and minimum run time.
The worst cycling is not necessarily at the smallest demand.
Combining the time equations gives N = 60Qd(Qp − Qd)/(ΔVQp). This quadratic reaches its maximum at Qd = Qp/2. At 50 L/min demand, the assumed 200 L arrangement reaches 39.57 starts/hour. A low-demand test at only one operating point can therefore miss the worst cycling condition.
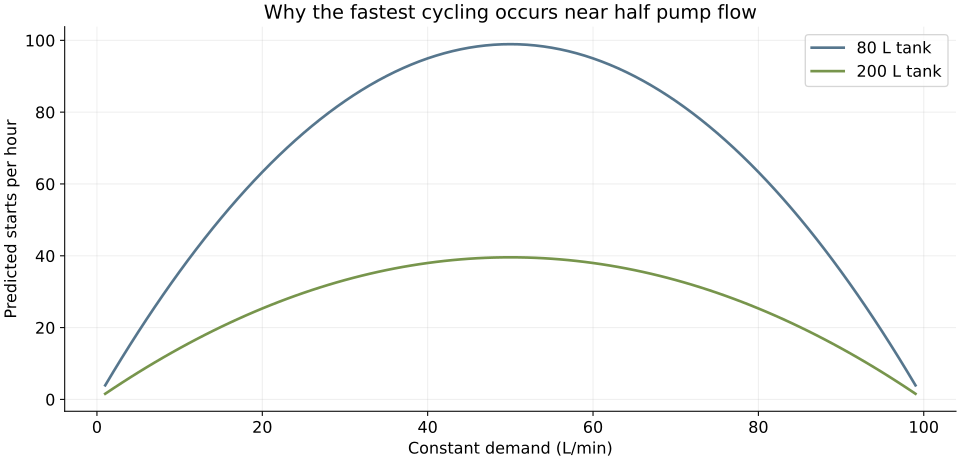
At zero demand there is no withdrawal-driven restart. At demand equal to pump flow, the pump cannot refill the tank while serving that demand; the repeating-cycle model no longer applies. At higher demand, pressure may fall unless another pump stages in.
6. Check whether 200 L is enough—not just better.
At zero demand, minimum fill run time is ΔV/Qp in this ideal model. The 200 L example provides only 37.91/100 = 0.3791 min, or 22.74 s. If the selected motor and controls required a one-minute minimum run, the required drawdown would be 100 L, corresponding to roughly 528 L nominal volume at these pressure assumptions.
This does not contradict the reported project choice. It demonstrates why the real pump curve, controls, operating pressures, motor limits and test results must govern selection. A teaching model with invented pressures cannot certify the original 200 L tank.
A wider switch band usually increases drawdown, but the building still needs adequate minimum pressure, and all components must tolerate maximum pressure and transients. Shutoff head, relief arrangements and pressure-vessel ratings need separate checks. Manufacturer guidance governs pre-charge; for example, the cited Amtrol product manual specifies a setting below cut-in and a depressurized water side when checking it.
7. Make the duplex controls part of the solution.
A larger tank buys time; it does not repair a leaking check valve, faulty pressure sensor or badly tuned staging sequence. Review lead/lag alternation, start and stop thresholds, minimum run/off timers, low-suction protection, proof of operation and fault response against the actual package requirements.
Pressure should be sensed at the intended controlled location. A restricted or isolated tank connection can make the nominal tank ineffective. A passing check valve can discharge storage backwards, causing starts even with no user demand. Loss of pre-charge or a failed bladder reduces useful drawdown.
Repeated starts can increase electrical and mechanical duty. Fast check-valve closure can create transient loads, but the quasi-steady tank model does not calculate water hammer. Likewise, reduced cycling does not independently prove the root cause of every seal failure. Confirm alignment, dry running, temperature and operating-range issues where evidence points to them.
8. Inspect the arrangement in 3D.
The layout study makes the component relationships visible: two pump/motor envelopes, a common discharge header, skid and a vertical tank envelope. The tank’s ideal gas-volume reference is a 500 mm internal-diameter cylinder about 1018.6 mm long for 200 L. Actual certified tanks have different internal geometry and external dimensions.
3D model loads when this section is reached.
No shell thickness, pressure rating, piping stress result or fabrication approval is implied by these envelopes. Detailed isolation, relief, drains, sensing and service access require a package design.
9. Explore tank size and demand.
Fixed example: 3/4 bar gauge switch band, 2.8 bar gauge pre-charge, 1.01325 bar atmosphere and constant 100 L/min lead-pump delivery. Isothermal gas model.
10. Close the loop with a recorded test.
- Confirm the tank model, allowable pressure, manufacturer drawdown data and actual pre-charge procedure.
- Record pump curves, pressure thresholds, actual sensing position and the lead/lag sequence.
- Test zero, low, intermediate and high demands. Record pressure versus time, pump states, run times and starts per hour.
- Check current/loading against the selected motor requirements and verify check-valve operation.
- Check minimum user pressure, cut-out, staging, restart and applicable fault responses.
- Investigate residual surges separately rather than assuming that a larger tank eliminates every transient.
Still unresolved by this study: the real switch settings, pump flow across the band, motor cycling limits, measured pressure traces and transient response. Those records establish an acceptance decision.
Models, calculations and references.
Downloads follow the scope stated at the top of this study.
Reference: Amtrol Well-X-Trol installation and operation manual. Product-specific instructions must be checked against the selected tank.